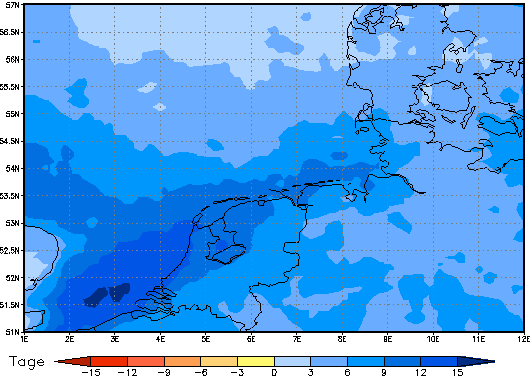
Wadden Sea: Possible largest increase of the rainy days in summer until the end of the 21st century (2066-2095) compared to today (1961-1990): Ambiguous

View:
Progress bar
RCP4.5 - IPSL-CM5A-MR - WRF331F (EUR-11)
Info Range diagram
Mean mark
+7 days
Possible largest increase
Wadden Sea:

Until the end of the 21st century (2066-2095) the possible largest increase of the rainy days in summer may be 7 days compared to today (1961-1990).

This map is a result of the assumption of a certain greenhouse gas concentration used in a certain regional climate model:

More results of the same climate scenario

If you have questions concerning these maps, click here and write us. as 02/2023

This website is steadily updated, thus some results may change.

Note:
The maps of this website are freely available for private use. Publication of contents or maps only with permission of the North German Climate Office.

Norddeutsches Klimabüro
Helmholtz-Zentrum Geesthacht
Zentrum für Material- und Küstenforschung GmbH
Institut für Küstenforschung

Max-Planck-Straße 1
21502 Geesthacht

E-Mail: info@norddeutscher-klimaatlas.de
WWW: www.norddeutsches-klimabuero.de

Schließ
 

To view the region "" you are now leaving the Coastal Atlas and switch to "Norddeutschen Klimaatlas""Regionalen Klimaatlas Deutschland""Ujście Odry Atlas Klimatu".

You are now leaving Coastal Atlas and switch to "Norddeutschen Klimaatlas""Regionalen Klimaatlas Deutschland""Ujście Odry Atlas Klimatu".

Ok Cancel